Susquehanna River at Danville, Pa.
Overview
- Station Id: 01540500
- County: Montour
- Drainage Area: 11,222 sq.mi.
- Station Coordinates: 40.958°, -76.621°
- Period of record: 10/84 to present
Location Description
The sampling location is on the Mill Street bridge with the gage located on the west bank, 200 feet upstream of Mill Street bridge.
Data
- Data File Description
- DAN.xlsx October 1984 to present
2021 Land Use
| Urban | Agricultural | Agricultural | Forested | Other | ||
|---|---|---|---|---|---|---|
| Row Crops | Pasture/Hay | Total | ||||
| 9% | 4% | 21% | 25% | 60% | 6% | |
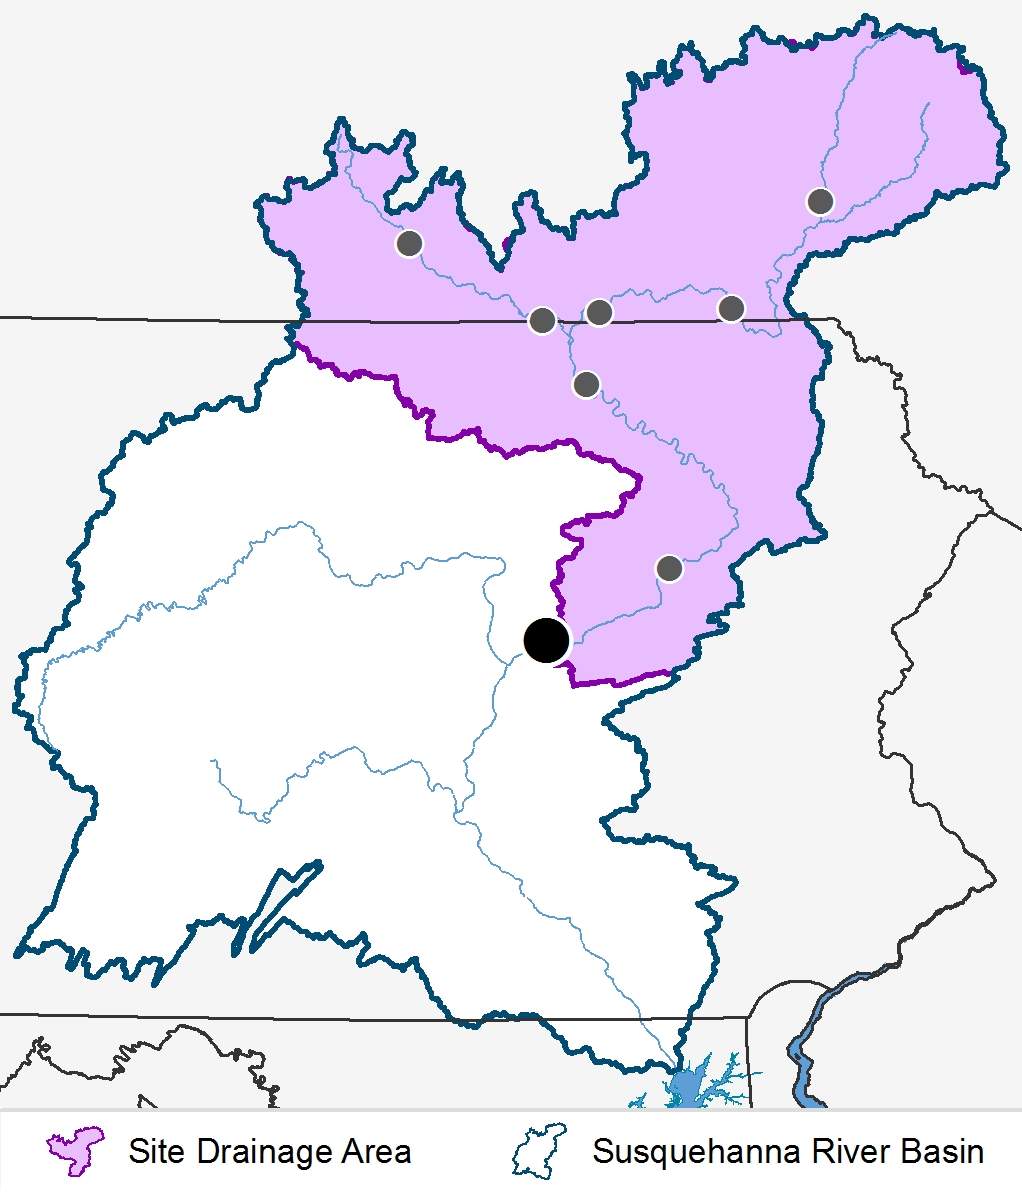
Site Drainage Area
Please select a parameter from the list to view graphs of loads and concentrations. You may need to scroll down to view graphs.
Loads
Concentrations
Data
2024 Flow Normalized Trends
| Trend period (Water Year*) | 1985-2024 |
|---|---|
| Trend & Direction | NS – Not significant, UP – Increasing trend, DOWN – Decreasing trend |
| Hypothesis Test significance level (i.e. α) | 0.1 |
| * Water Year runs from October 1st to September 30th of the following year | |
| Likelihood Descriptor | Range of values** |
|---|---|
| HL (Highly Likely) | ≥0.95 and ≤1.00 |
| VL (Very Likely) | ≥0.90 and <0.95 |
| L (Likely) | ≥0.66 and <0.90 |
| ALAN (About as Likely as Not) | >0.33 and <0.66 |
| ** Values represent the posterior mean estimate of the probability of a trend | |
| Danville 1985-2024 | Flow Normalized Concentration (mg/L) | Flow Normalized Load (Millions Kg/yr) | ||||||
|---|---|---|---|---|---|---|---|---|
| Likelihood Test | Likelihood Test | |||||||
| Parameter | Change | Value | Descriptor | Trend | Change | Value | Descriptor | Trend |
| Total Nitrogen | -0.8895372 | 0.9901961 | HL | DWN | -14.6208739 | 0.9901961 | HL | DWN |
| Nitrate-Nitrite | -0.3460087 | 0.9901961 | HL | DWN | -5.4334725 | 0.9901961 | HL | DWN |
| Ammonia | -0.0745683 | 0.9901961 | HL | DWN | -1.2980119 | 0.9901961 | HL | DWN |
| Dissolved Nitrogen | -0.5891456 | 0.9901961 | HL | DWN | -9.6805131 | 0.9901961 | HL | DWN |
| Nitrate-Nitrite | -0.3565006 | 0.9901961 | HL | DWN | -5.4802810 | 0.9901961 | HL | DWN |
| Ammonia | -0.0763452 | 0.9901961 | HL | DWN | -1.3209324 | 0.9901961 | HL | DWN |
| Orthophosphate | -0.0069308 | 0.9901961 | HL | DWN | -0.1011850 | 0.8137255 | L | DWN |
| Total Phosphorus | -0.0616443 | 0.9901961 | HL | DWN | -0.5770895 | 0.9509804 | HL | DWN |
| Particulate Phosphorus | -0.0397569 | 0.9901961 | HL | DWN | -0.2432236 | 0.7941176 | L | DWN |
| Dissolved Phosphorus | -0.0240123 | 0.9901961 | HL | DWN | -0.3916690 | 0.9901961 | HL | DWN |
| Total Organic Carbon | -1.8858156 | 0.9901961 | HL | DWN | -29.9829146 | 0.9901961 | HL | DWN |
| Total Suspended Solids | 5.2047267 | 0.7156863 | L | UP | 645.6590610 | 0.7549020 | L | UP |
| Suspended Sediment | -23.6494297 | 0.9901961 | HL | DWN | -660.6842701 | 0.7941176 | L | DWN |