Climate Change in the Susquehanna River Basin
Introduction
Climate change is a cross-cutting challenge that needs to be addressed in the objectives identified in the Commission’s Comprehensive Plan. Assessing regional climate projections and their impact on future hydrologic extremes will enhance flood and drought planning and climate resilience in the Susquehanna River Basin. This assessment leveraged the best contemporary models and data sources adapted for the basin. The 1991-2020 period, as designated by the PRISM dataset (https://prism.oregonstate.edu/normals/), served as the baseline climate period.
Methodology
The Coupled Model Intercomparison Project Phase 6 (CMIP6), led by the World Climate Research Programme (WCRP), provides the most recent modeling output data to understand past, present, and future climate change (https://wcrp-cmip.org/cmip-overview/). For a regional assessment, we employed the Localized Constructed Analogs (LOCA2, Pierce et al., 2023) downscaled datasets, including 20 of the CMIP6 models with consistent realization, initialization, physics and forcing indices. We were able to leverage the USGS National Climate Change Viewer, a valuable resource developed by Jay Alder and Steve Hostetler (2013). Climate data associated with precipitation and maximum and minimum air temperature were drawn from the CMIP6-LOCA2 dataset and a similar framework was employed to assess future spatial and temporal changes within the Susquehanna River Basin. Changes in fossil-fueled development shared socioeconomic pathway (SSP585) were averaged for two future periods, including 2045-2074 and 2075-2100.
Precipitation
Projected annual precipitation values from 20 climate models were plotted for two periods: 2045-2074 and 2075-2100. Given the inherent variability among climate models, a multi-model ensemble approach provided valuable insights into both the consensus and uncertainty of future precipitation projections. Between 2045 and 2074, 35% of the climate models projected a decrease in annual precipitation relative to the baseline period, while 65% indicated an increase. In contrast, 85% of the climate models forecasted an increase in annual precipitation towards the end of the century.
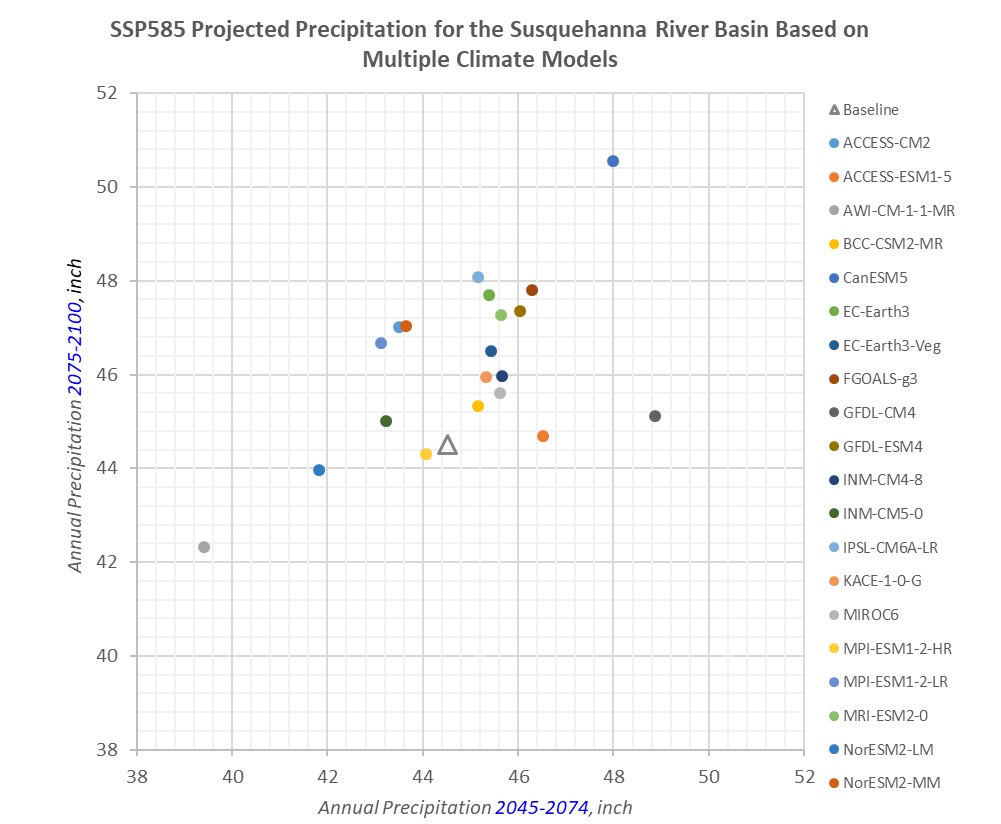
Three basin maps of mean model simulations are presented below to depict the spatial variability of annual precipitation over various time periods. The relative distribution of annual average rainfall, including more abundant precipitation in the Middle and Lower Susquehanna Subbasins and less abundant precipitation in the Chemung Subbasin, is projected to persist from the baseline period to 2045-2074. The Susquehanna Basin is projected to see widespread increases in precipitation by the end of the century, though the magnitude of these increases may vary regionally.
Precipitation: 1991–2020
Precipitation: 2045–2074
Precipitation: 2075–2100
Projected Precipitation Comparison
Select Comparison
Select a baseline and projection, then drag the slider to compare changes across time periods.
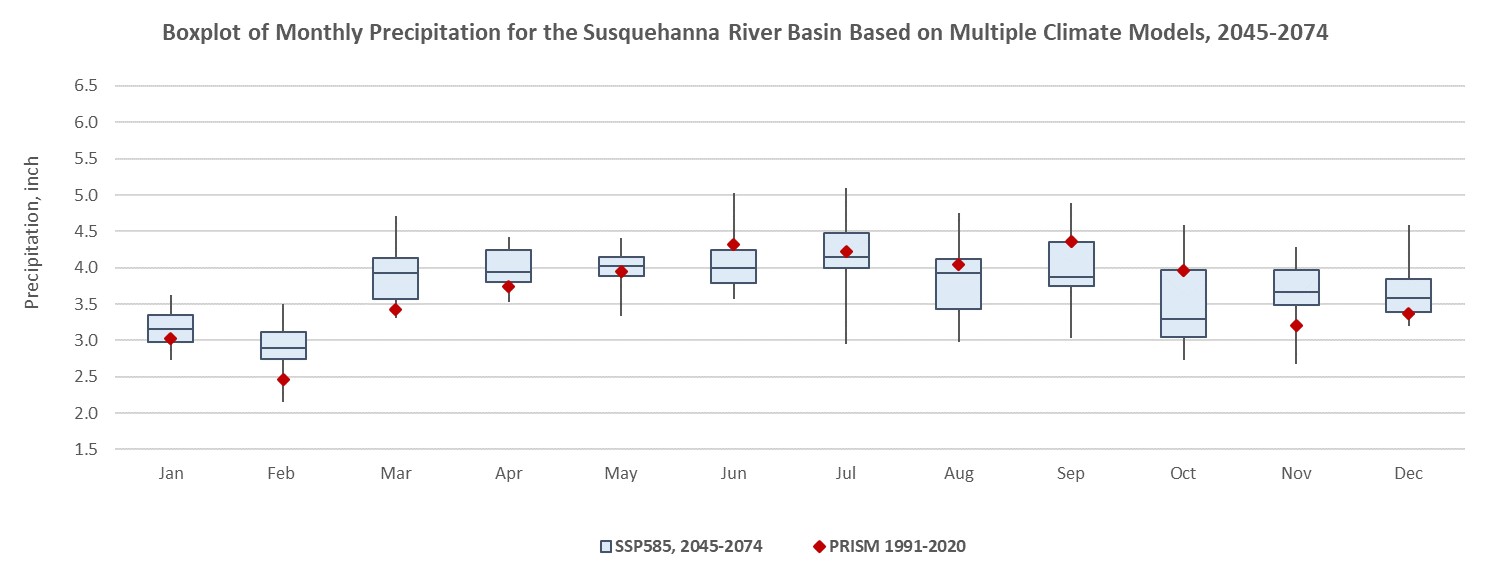
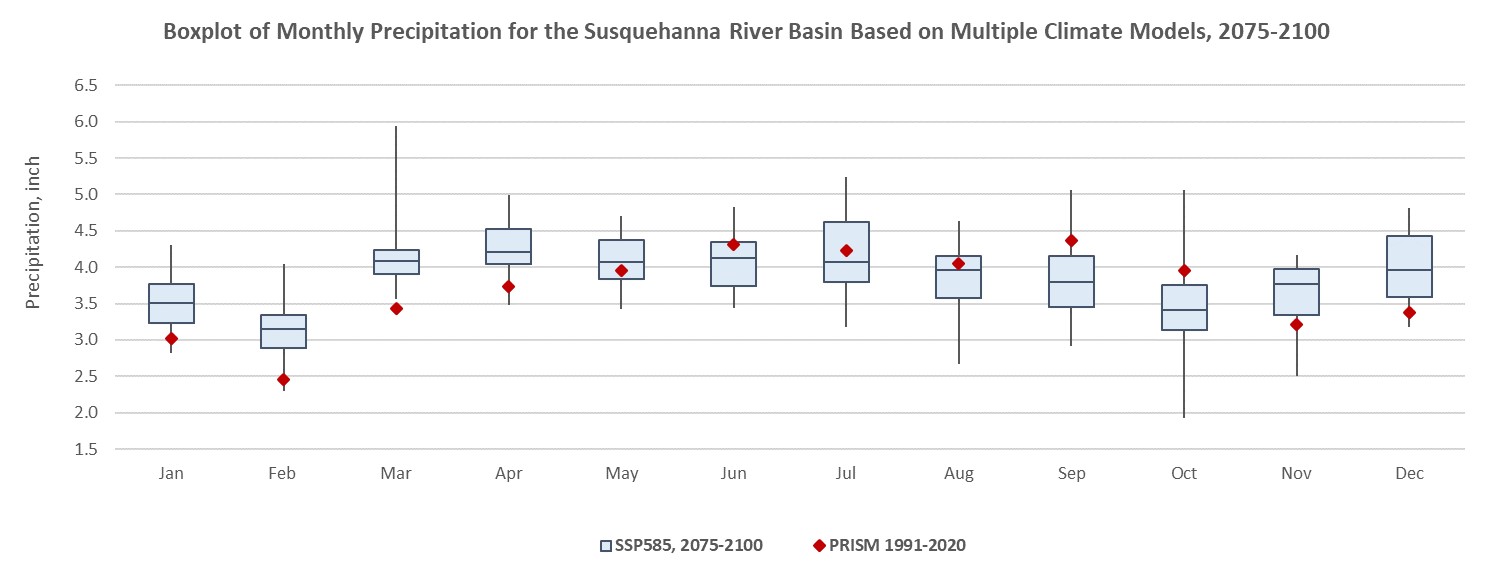
Seasonal variations in precipitation are a significant factor in hydrological processes. Boxplots of 20 model simulations highlight the different seasonal trends in future precipitation. For the 2045-2074 period, most climate models project increased precipitation in November through April compared to the baseline period. Conversely, 50% to 75% of climate models forecast decreased rainfall during the July-October period. This trend becomes more pronounced as the century advances, potentially resulting in elevated flood risk during winter/spring months and intensified drought conditions during the summer and early fall.
Projected Monthly Precipitation (Boxplots)
Drag the slider to compare projected 2045–2074 and 2075–2100 monthly precipitation distributions.
Daily Maximum and Minimum Temperature
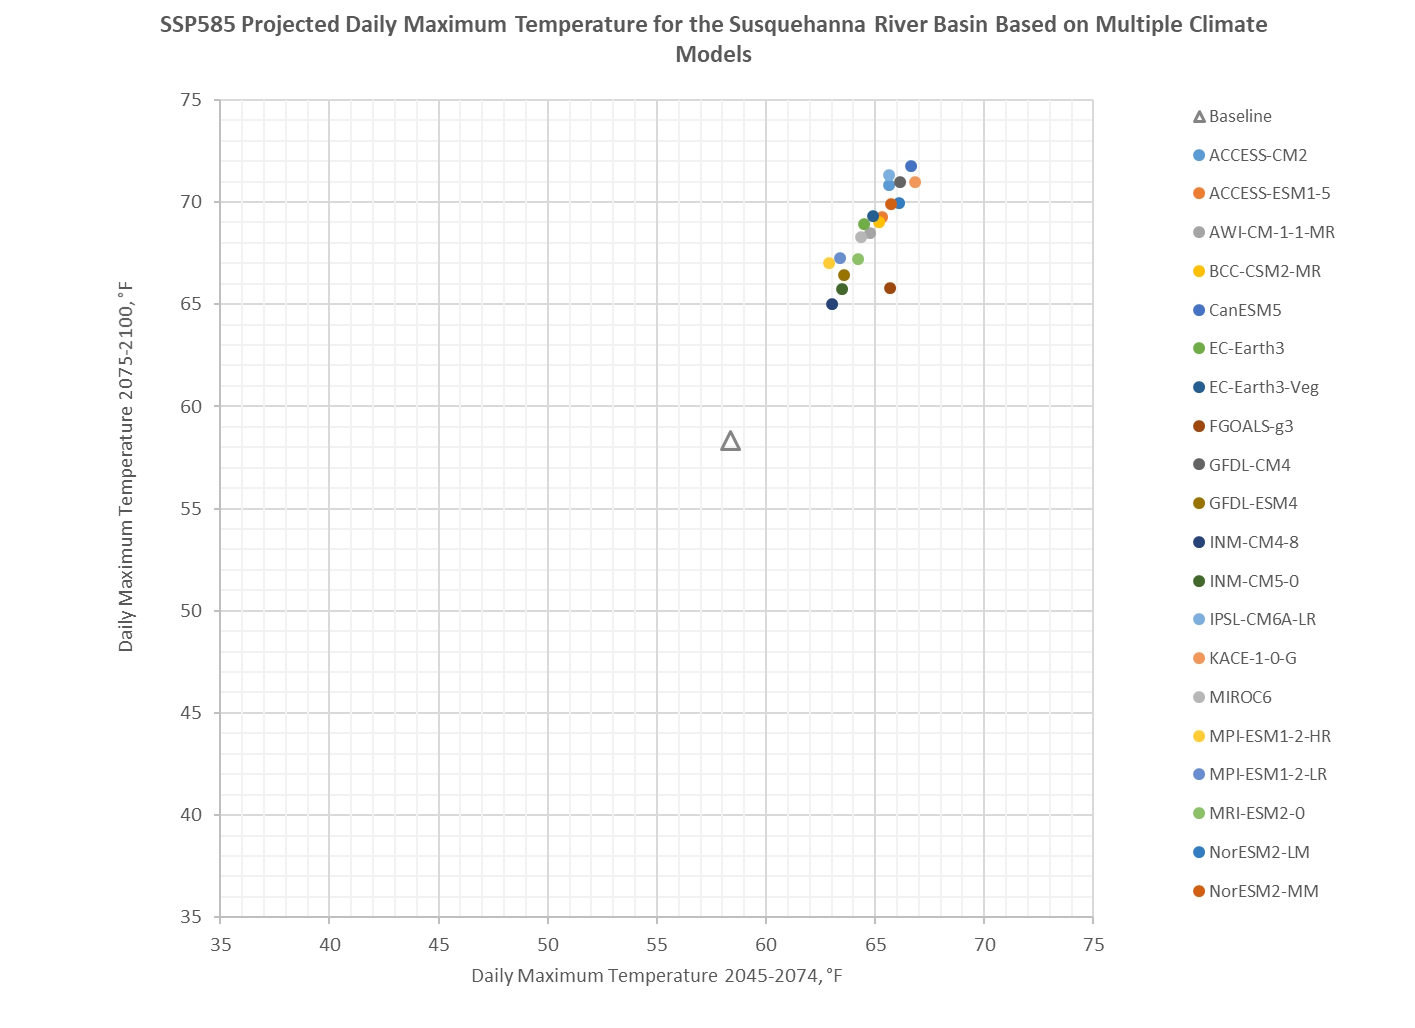
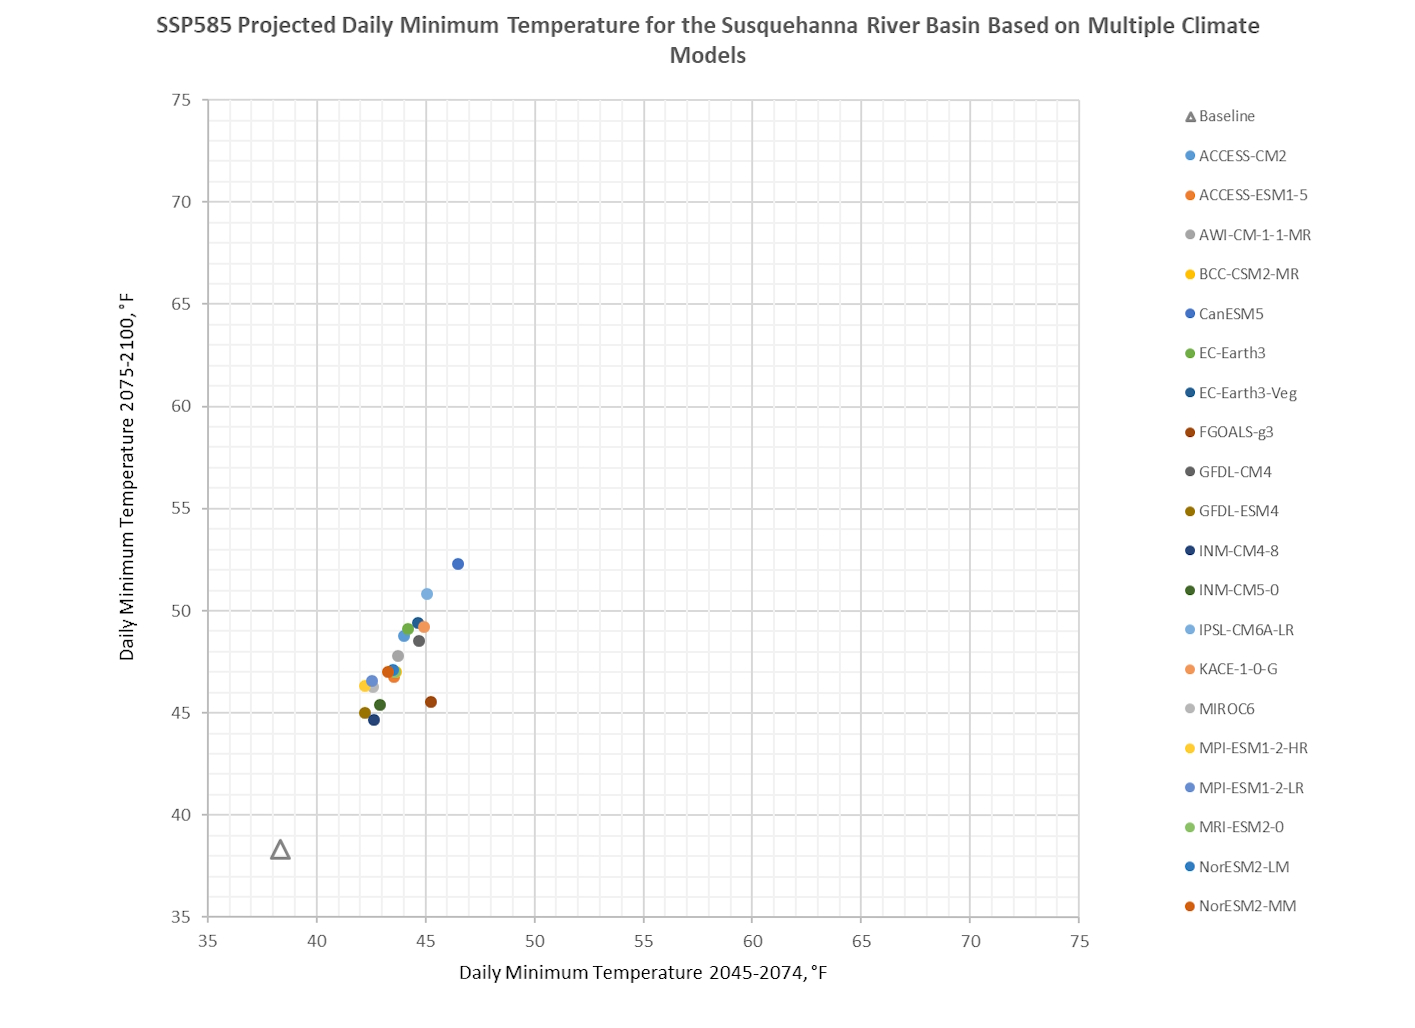
Projected daily maximum (Tmax) and minimum temperature (Tmin) from 20 climate models were plotted for two periods: 2045-2074 and 2075-2100. Unlike precipitation, all climate models consistently projected an increase in both Tmax and Tmin from the baseline period to the two future periods. Projected Tmax increments are estimated to range from 4.5 to 8.5°F during 2045-2074 and from 6.6 to 13.4°F during 2075-2100. Similarly, projected Tmin increases are expected to range from 3.9 to 8.2°F during 2045-2074 and from 6.3 to 14.0°F during 2075-2100. These ranges for Tmax and Tmin demonstrate comparable magnitudes.
Projected Temperature Comparison
Toggle View
Select a temperature view using the radio buttons above — choose between maximum and minimum projections.
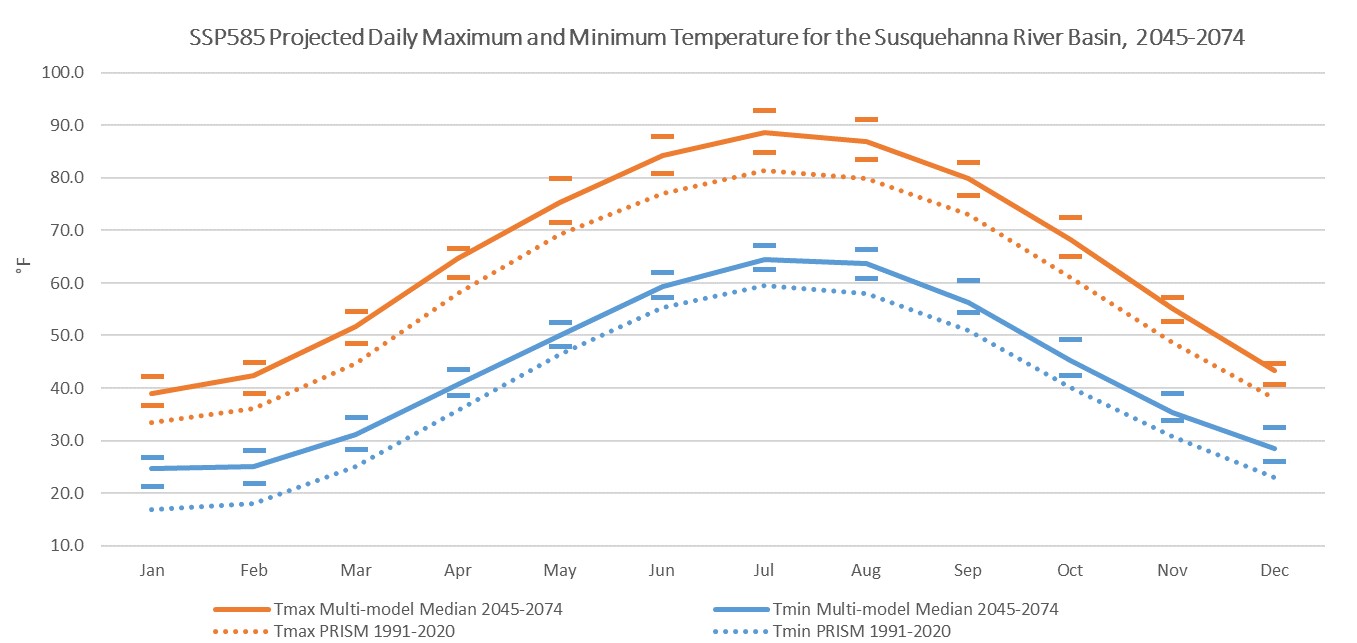
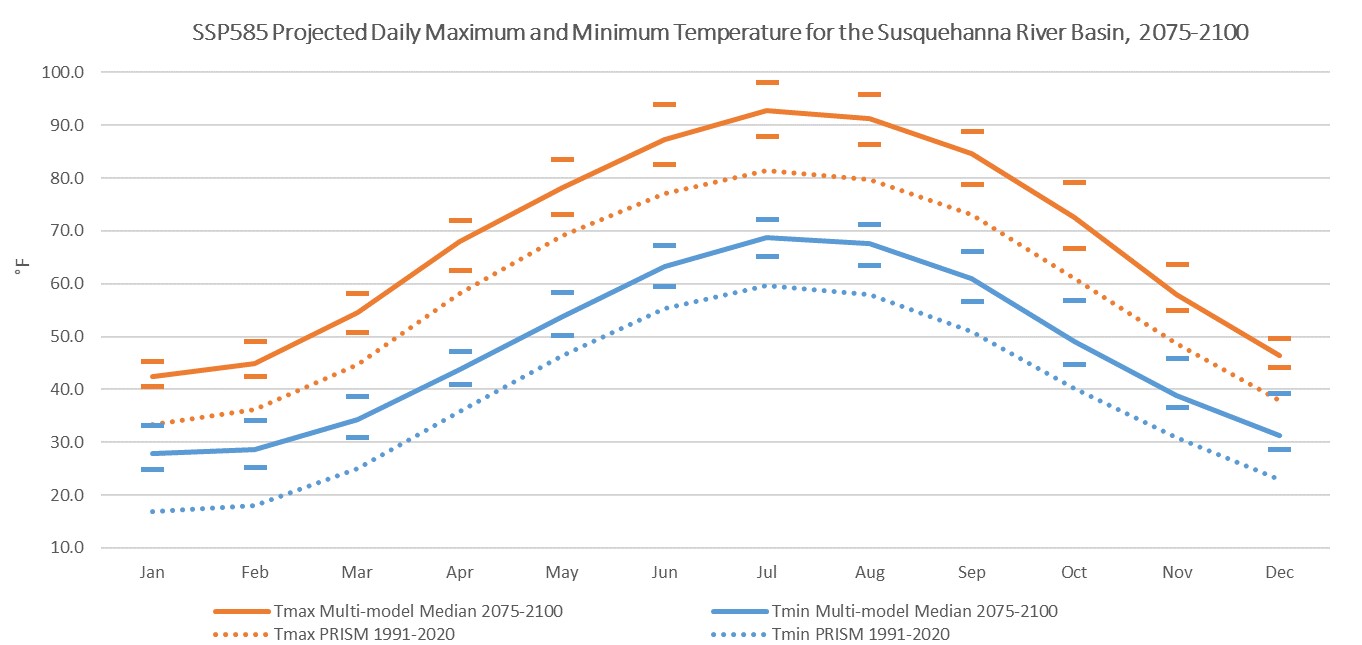
The line plots below illustrate the monthly distribution of temperature increases throughout the year. The range of model results is represented by the short bars, and the average is represented by the solid line. Increases are projected to occur in all months, varying in magnitude. For Tmax, the most substantial increases are anticipated from July to October, averaging 7.1°F during 2045-2074. Conversely, the most pronounced increases for Tmin are expected in January and February, averaging 7.4°F during the same period. Toward the end of the century (2075-2100), the projected increases intensify, reaching 11.5°F for Tmax from July to October and 10.9°F for Tmin in January and February.
Projected Daily Maximum and Minimum Temperatures (Line Plots)
Drag the slider to compare 2045–2074 and 2075–2100 projected daily maximum and minimum temperature trends for the Susquehanna River Basin.
Basin maps of mean model simulations are presented below to depict the spatial variability of Tmax and Tmin over various time periods. Annual Tmax within the basin is projected to increase from 58.4°F to 64.9°F between the baseline period and 2045-2074, and further increase to 68.4°F by 2075-2100.
Annual Tmin within the Susquehanna River Basin is projected to increase from 38.3°F to 43.7°F between the baseline period and 2045-2074, and further increase to 47.4°F by 2075-2100.
Projected Max Temperature
Projected Min Temperature
Summary
This assessment investigated how future precipitation and temperature are projected to vary spatially and seasonally compared to baseline data, accounting for model variance.
- Increases in daily maximum and minimum temperatures
- Increase in annual precipitation, with the trend strengthening towards the end of the century
-
Although it may be warmer and wetter, seasonal variations are expected
- More precipitation in the spring/winter months (less snowpack, increased flood risk)
- Less precipitation in the summer/fall months (increased drought risk)
Implications to Water Resources Management
Projected temperature increases may lead to broad declines in snowstorm frequency, snowpack accumulation, and snow season length. Faced with predicted increases in winter and spring precipitation, the Commission should promote actions aimed at enhanced stormwater management and restoration and protection of floodplains and riparian buffers. It is equally important to recognize that water supply could encounter challenges during low flow months, particularly in areas with high demand, during periods of decreased precipitation, and for systems without redundancy. The modeled forecasts emphasize the importance of the Commission’s ongoing focus on water availability, sustainable allocations, water conservation, reservoir operations, and groundwater recharge to ensure adequate water supply. The combined impacts of altered precipitation patterns and rising temperatures may increase the frequency and intensity of both flooding and drought events. Water quality could be downgraded by warming streams, shifting fish communities, exacerbating invasive species spread, and increasing the frequency and intensity of harmful algal blooms. Such changes would threaten the health and biodiversity of aquatic ecosystems and could impact drinking water supplies and recreation. Strengthening warning systems and improving stormwater, reservoir, and groundwater management are crucial for building climate resilience.
Citations
Alder, J.R. and S.W. Hostetler. 2013. USGS National Climate Change Viewer. U.S. Geological Survey:
https://doi.org/10.5066/F7W9575T
Pierce, D.W., D.R. Cayan, D.R. Feldman, and M.D. Risser. 2023. Future Increases in North American Extreme Precipitation in CMIP6 Downscaled with LOCA. Journal of Hydrometeorology, 24(5), 951–975:
https://doi.org/10.1175/JHM-D-22-0194.1